


Cleared for Takeoff: Delta Air Lines (DAL) at a Crossroads
A deep dive into Delta’s fundamentals and chart signals, what to expect from its earnings report and beyond

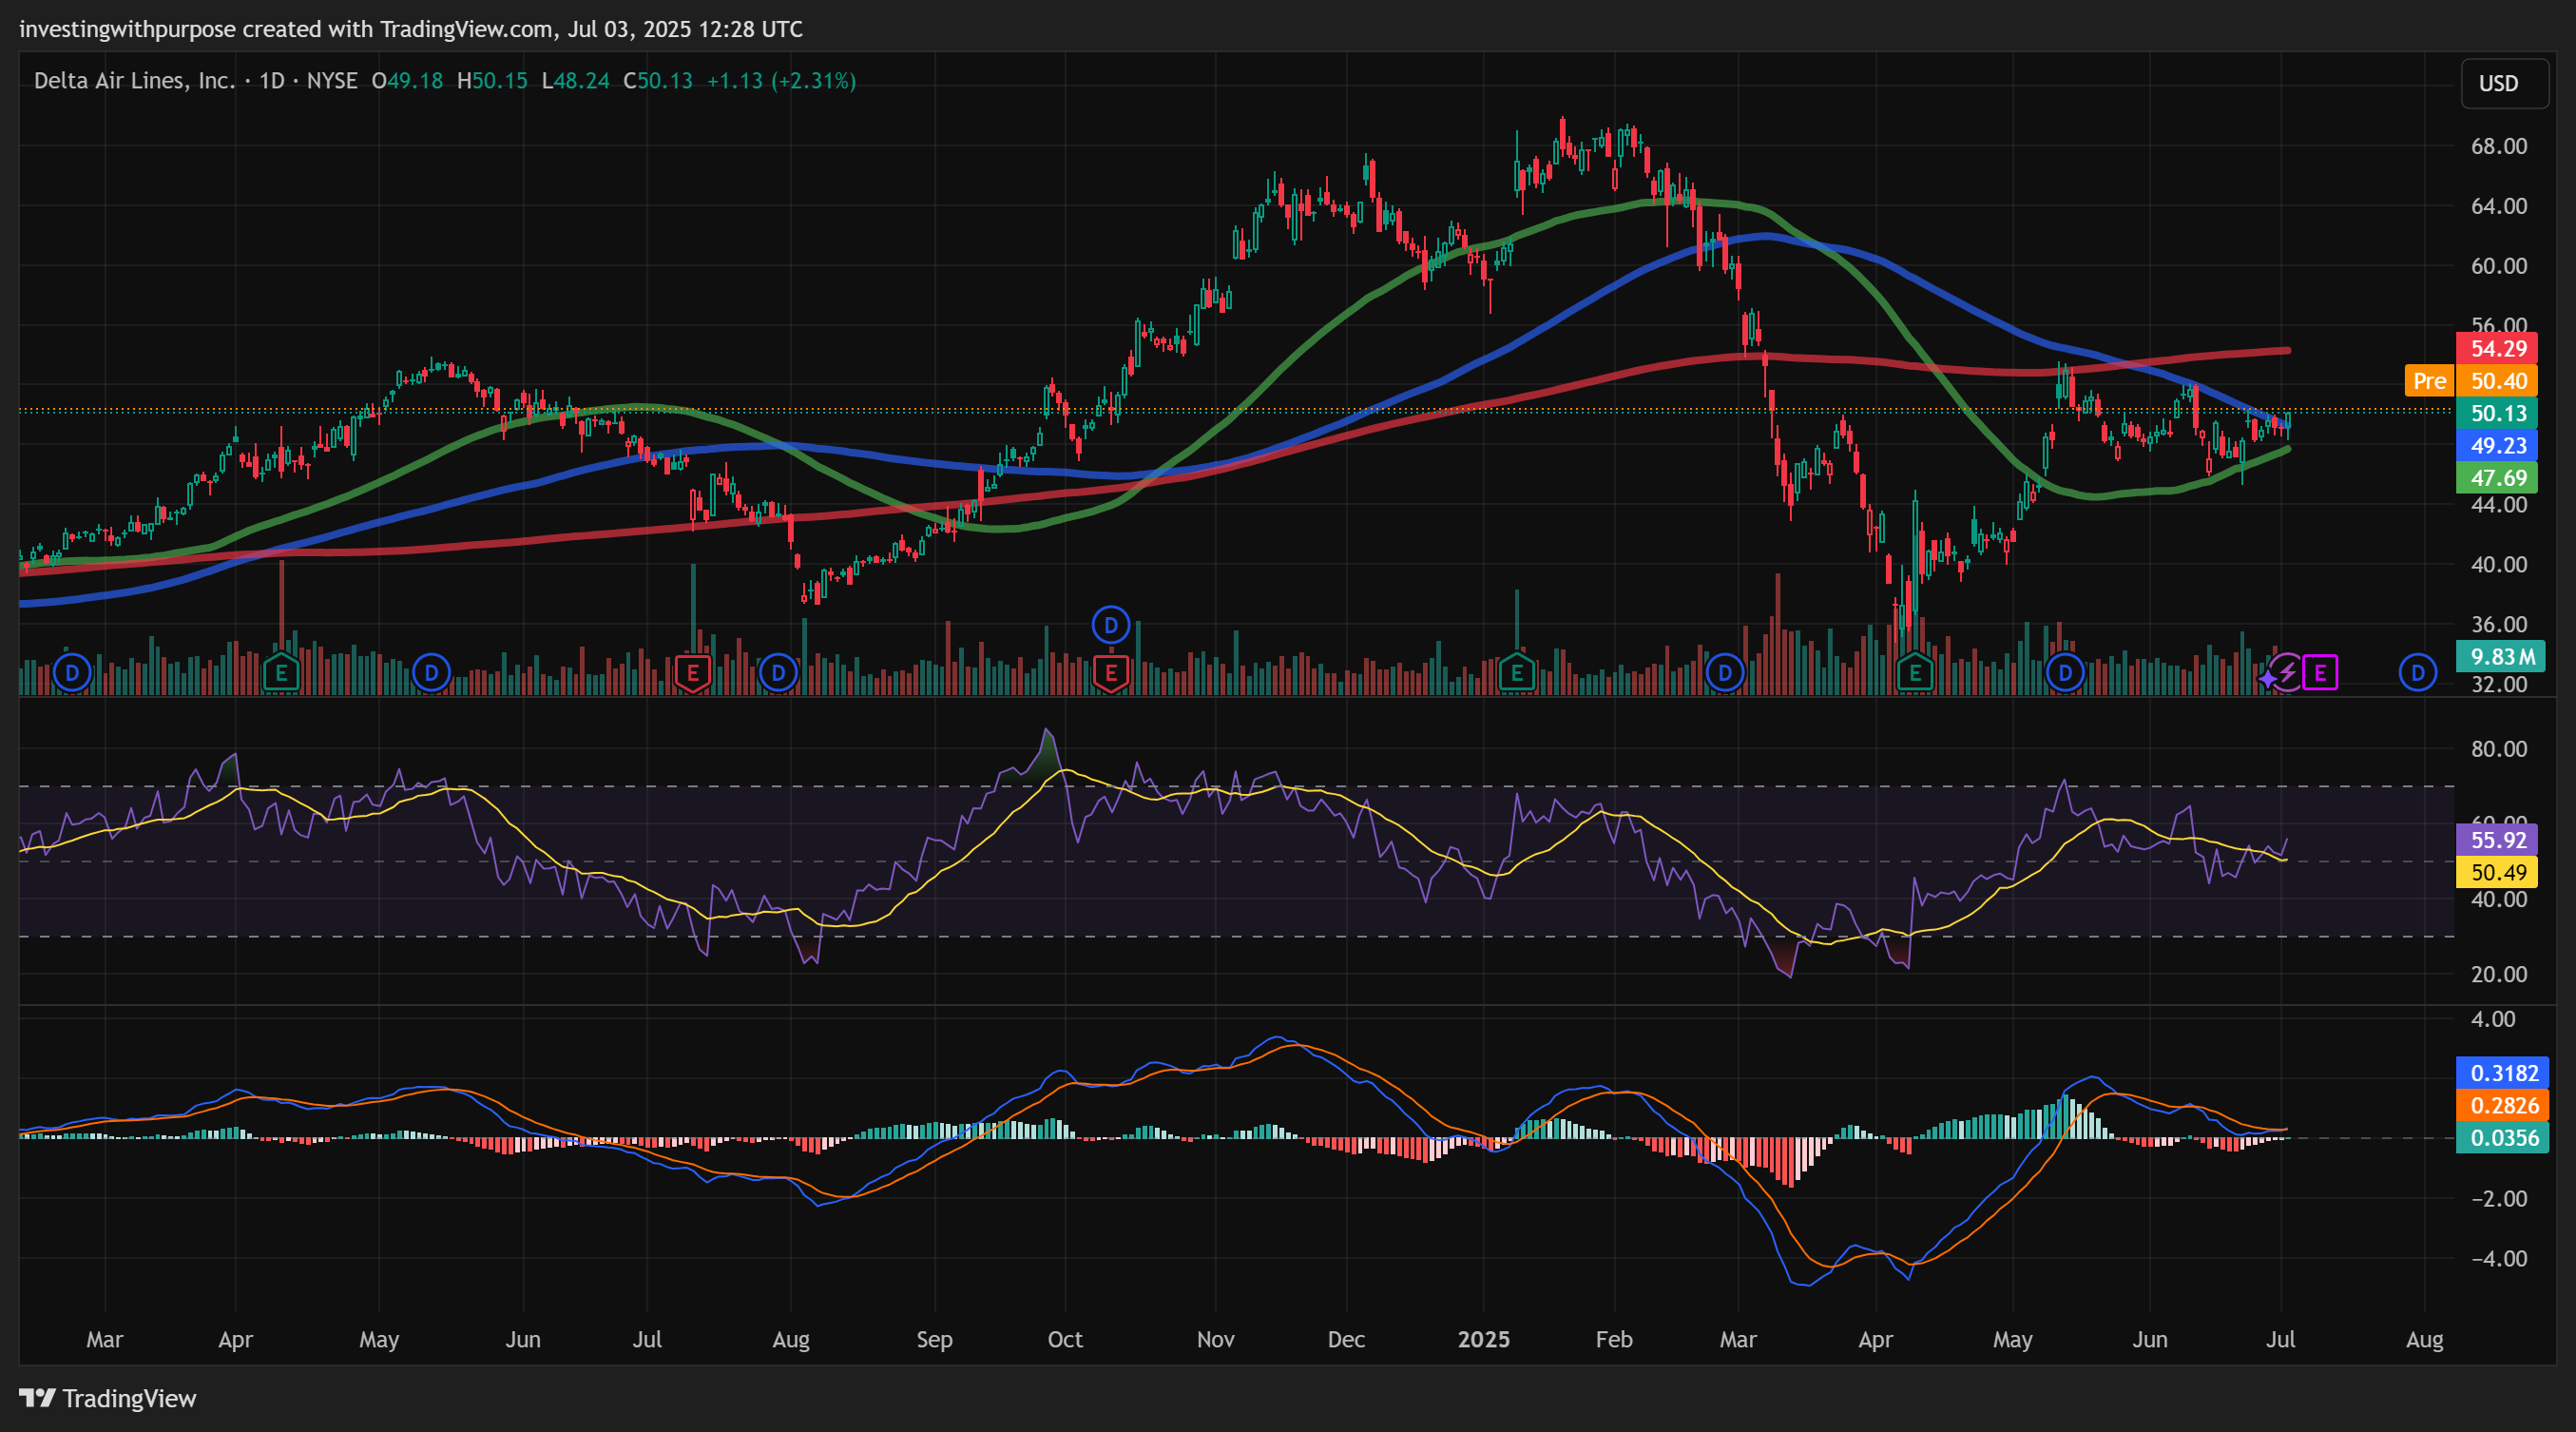
Delta Air Lines DAL 0.00%↑ closed yesterday at $50.13, trading up roughly $0.32 in pre-market ahead of its Q2 earnings due in just a couple of hours. After a rocky 2023–2024 recovery and a choppy range so far in 2025, the stock sits at a critical juncture. In this report, we’ll unpack the story behind the numbers, decode today’s chart patterns, and lay out both an investment and a near-term trading plan.
Key Takeaways
Fundamentals: Revenues and free cash flow have rebounded to near pre-pandemic levels; margins face pressure from fuel costs and labor; leverage remains elevated but manageable given strong operating cash flow; analysts forecast mid-single-digit EPS growth in FY 2026.
Technicals: DAL has formed a tight $48–$51 range on daily charts, with key Fibonacci resistance at $49.60 (78.6% retracement) and major upside extensions at $51.00 (1.618) and $52.80 (2.618); moving averages are coiling for a potential squeeze; low ADX/ATR point to a low-volatility build-up.
Trade Plan: Buy the breakout above $51.00 with a first target at $55.00 and a stop just below $50.00. If EPS disappoint, look for a dip toward $48.00–$47.00 as an entry zone.
Investment Stance: For long-term investors, consider scaling in on any post-earnings pullback toward the $45.00–$47.00 level. Delta’s sturdy cash flows and modest yield (~2%) support a buy-and-hold approach once volatility settles.
Fundamental Analysis
1. Revenue & Profit Trends
Revenue Recovery: Q1 2025 revenues of $12.7 billion marked a 15% YoY rise, approaching 2019 levels. RPKs (Revenue Passenger Kilometers) are at ~95% of pre-pandemic highs.
Margins Under Pressure: Fuel expenses remain elevated, consuming ~25% of operating costs. Adjusted EBIT margin sits around 13%, down from 16% in Q2 2022.
Leverage & Liquidity: Net leverage stands at about 3.2 × (Net Debt/EBITDA), which is higher than most of its airline peers, but is well supported by its strong EBITDA run‐rate (roughly $8 billion last twelve months) and solid free cash flow generation (about $5 billion LTM). This gives Delta ample capacity to service debt and continue returning capital to shareholders.”
2. Cash Flow & Capital Allocation
Operating Cash Flow: $6 billion LTM.
CapEx Outlook: Maintenance and fleet renewal CapEx estimated at $2.5 billion in FY 2025.
Shareholder Returns: Quarterly dividend of $0.46 (≈2% yield) and opportunistic buybacks guided at $1.5 billion for the year.


3. Analyst Forecasts
EPS Growth: Consensus projects $8.20 in FY 2025 EPS, rising to $8.60 in FY 2026 (~5% growth).
Valuation: Trading at ~6× forward EBITDA and 8× forward earnings, modest premium to legacy carriers but at a discount to historical averages.
Delta’s top-line momentum is intact, but margin headwinds and elevated leverage keep the stock range-bound until we see clearer operating leverage play out.”
Technical Analysis
1. Price Structure & Key Levels
Range Bound: Since May, DAL has oscillated between $48.00 support and $51.00 resistance.
Fibonacci (daily swing low $45.18 → high $49.98):
0.618 retrace at $47.86
0.786 retrace at $48.52 (tested twice)
1.618 extension at $52.18
2.618 extension at $37.17 (bear case)
When a plane taxis, it’s gathering momentum for takeoff, or a taxi back to the gate.
2. Moving Averages & Cloud Signals
50-, 100-, 200-day SMAs are converging around $49.00–$50.00 a “squeeze play.”
Ichimoku Kumo (daily) is flat, with price sitting just above the Tenkan (blue) and Kijun (red) lines. No clear cloud-breakout yet.
3. Indicators
ADX (14): Sub-15, indicating weak trend, prelude to a potential breakout.
ATR: Compressed near $1.70 (daily), suggesting low volatility.
MACD (daily): Slightly positive histogram; MACD line edging above signal.
RSI (daily): 56, recovering from mid-40s; no overbought condition.
Stoch RSI (2-hour): Near 80, short-term overbought, but room to resolve in either direction.

Earnings Catalyst & News Considerations
Fuel Hedging: Delta’s fuel hedges for H2 2025 cover ~40% of expected consumption at $2.40/gal, down from $3.00/gal in H1.
Operational Updates: Expect commentary on fleet utilization, ancillary revenue growth, and progress on cost-saving initiatives.
Macro Headwinds: Recent labor negotiations and geopolitical air-traffic disruptions could color guidance.
Earnings day: the runway lights are on, are we cleared for takeoff?
Our Investment Plan
Near-Term Trade (Earnings Reaction):
Long Breakout: If EPS & guidance beat and price clears $51.00 with volume, initiate a long position.
Entry: $51.10
Stop: $50.00
Targets: $55.00 (initial), $60.00 (extended).
Sell the Rip: If price pops >4% on the open, consider taking partial profits into strength.
Quick Reversal: On a disappointing print pushing DAL below $49.00, short toward $48.00, targeting $45.00 on further weakness.
Long-Term Investment:
Accumulate on Dips: $45.00–$47.00 zone represents solid value based on FCF yield (~8%) and normalized margins.
Hold Horizon: 12–24 months to ride broader market re-rating as air travel normalizes further.
Risk Management: Use a trailing stop around 10% under cost basis.
Conclusion
Delta Air Lines sits at the confluence of recovering fundamentals and poised technical build-up. Next week’s quarterly report will likely dictate the next directional move, offering either a springboard toward fresh highs or a buying opportunity on a post-earnings pullback. With robust cash flows, a reasonable valuation, and clear trading levels in sight, DAL remains one of the most compelling airline names—whether you’re looking to trade the catalyst or invest for the broader industry recovery.
Fasten your seatbelts: Delta’s about to announce its flight plan for the next leg.